Catch outages with multi-region validation before alerting
Checks from multiple regions + consensus validation + advanced API monitoring with JSON assertions. Fewer false positives, higher precision.
We do not alert on a single check. We validate before alerting.
Not just a green ping — our differentiator
It is not just uptime. It is real distributed validation.
Many tools tell you the host responds. Status Inspector is built for when that is no longer enough: APIs returning 200 with error payloads, latency burning support, and decisions backed by real consensus.
- Checks executed from multiple regions
- Consensus validation before alerting
- Fewer false positives
- Higher precision in outage detection
If you tried classic monitoring and still found issues manually, you have found the right tool.
Real HTTP
Not just ping—we validate real responses
Fewer false positives
Content and logic validation
Catch degradation
Do not wait for everything to fall over
Smarter alerts
Real distributed architecture
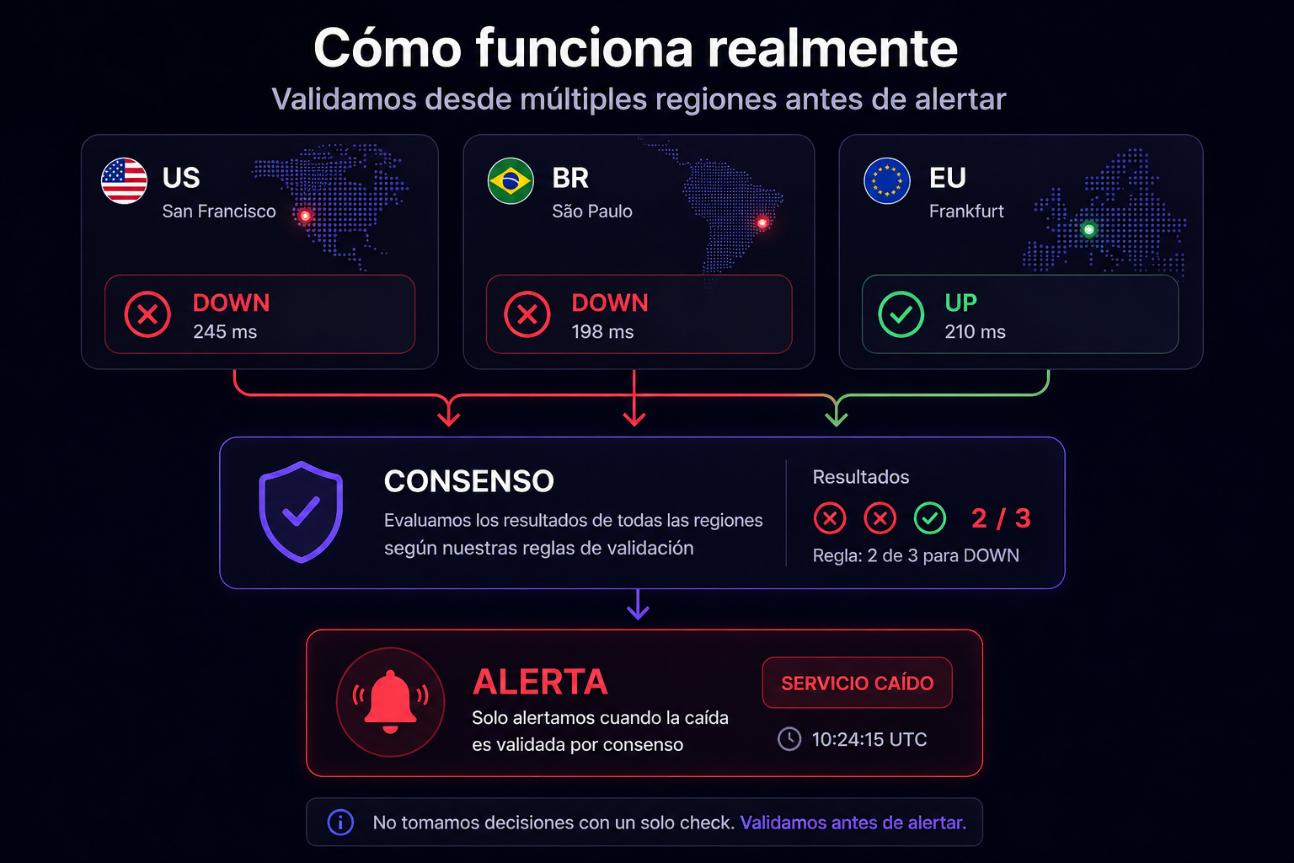
How it really works
Real distributed monitoring with consensus-based decisions.
We execute checks from multiple regions
Each region reports its result
We apply consensus to validate the outage
We only alert when there is certainty
We do not make decisions from a single point of failure.
6 ways to cover web, API, and infra
Up to 60 checks/hour per service
4 roles: clarity for the whole team
6+ channels where we notify you instantly
Uptime monitoring and API monitoring for SaaS companies and DevOps teams
Built for teams that cannot afford to fail
A website monitoring SaaS for technical teams and product teams: one panel for uptime monitoring and API monitoring, with actionable alerts and less noise.
SaaS
Reduce churn from outages: your customers often notice before the API or app stops delivering what you promised.
DevOps
Reliable, low-noise alerts: thresholds, degradation, and clear incidents so you can prioritize without burning the team.
Business
Protect revenue and reputation: shared visibility with status pages and fewer support surprises.
Trusted by teams that cannot fail
+1,000
Active monitors
+50,000
Checks executed across multiple regions
99.9%
Detection precision thanks to multi-region validation
Stop learning about it when it is too late
For teams that depend on web, APIs, and background jobs. The cost is not only technical: engineering time, support tickets, and customer trust.
Many tools alert on the first failure. We validate before alerting.
Every minute down means lost money
Frustrated users, lost sales, and churn. Status Inspector catches issues before they escalate.
From multiple checks to one reliable decision
You define healthy; we execute, validate by consensus, and alert with confidence.
You configure the monitor
Target, rules, and thresholds according to service criticality.
We run distributed checks
Evidence is collected from active nodes across multiple regions.
We validate with consensus
Results are correlated to reduce false positives before deciding.
We trigger a reliable alert
We notify only when there is operational certainty.
One view of the real health of what you care about
State calculated from multiple regions, not a single check.
- • Single panel
- • Business + product + ops
- • One source of truth
Websites
Outages and latency in real time, with context in every alert.
APIs
Responses, timings, codes, and advanced rules on payloads
Infrastructure
DNS, TCP ports, SSL, and ICMP connectivity where applicable
Heartbeat
Cron and jobs that must “check in”. Catch silent failures from processes you cannot see
More capabilities
SSL
We monitor certificates and warn you ahead of expiry
Status pages
Public pages so you can show customers the health of your services
Alert rules
UP, DEGRADED, DOWN, thresholds, and multi-region detection context
REST API & automation
Automate creating and querying monitors and incidents from your own stack
Teams & roles
Invitations, four user roles, and multi-account.
History
Check reports, sent alerts, and incidents for retrospectives.
Maintenance windows
Define maintenance windows to silence alerts during deployments, migrations, or scheduled tasks.
Integrations
Connect with Zapier, Make, n8n, or your own system via webhook. Automate incident workflows without extra code.
Monitor groups
Organize and filter monitors by project, environment, or team. One view of health per area of your stack.
API Monitoring that validates what really matters
We validate responses, not just status codes.
We do not just verify responses. We validate behavior.
✔ Advanced JSON assertions
✔ Structure and content validation
✔ Custom rules per endpoint
✔ Detect errors even when status is 200
✔ Real monitoring of business logic
{
  "status": "ok",
  "data": {
    "users": []
  }
}
Expected users > 0 -> ERROR DETECTED
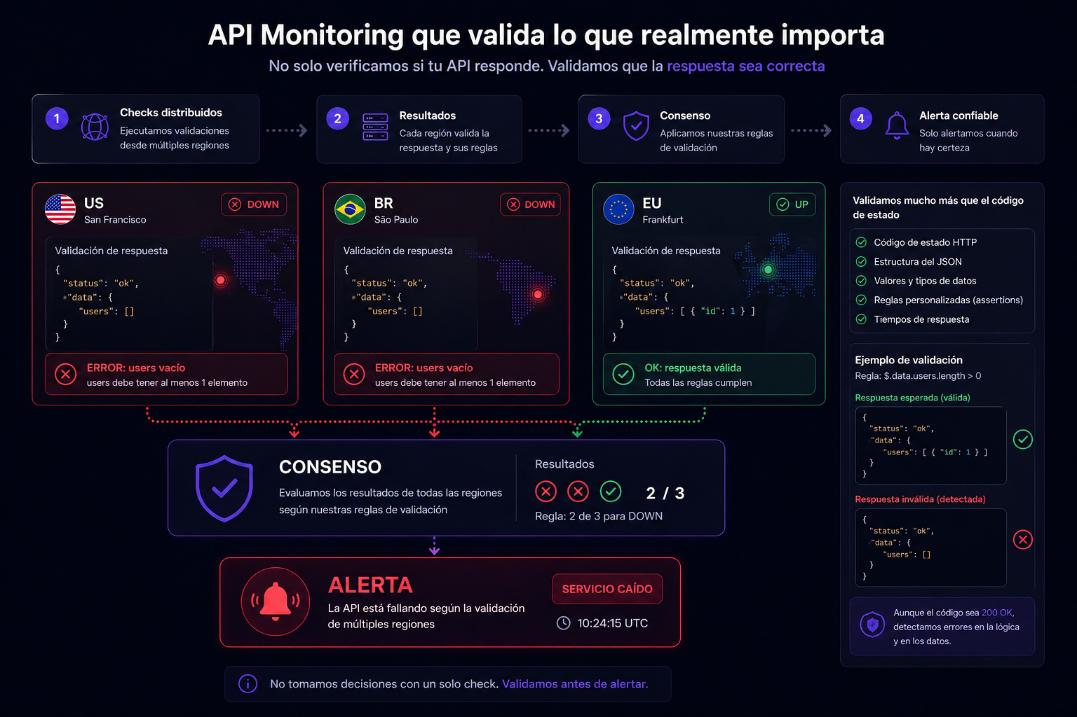
An endpoint can return 200 and still be broken. We detect it.
Why Status Inspector vs a “ping-only” monitor?
Many tools say “it is up.” We help you know whether the service delivers what your users need: API body, latency, certificates, and false positives under control—so you prioritize well when things go wrong.
Ping vs real functionality
Ping only checks response. Status Inspector validates real behavior.
Multi-region validation
Distributed checks confirm actual service state.
Consensus before alerting
No alert on isolated failures when evidence is inconclusive.
Advanced API monitoring
JSON assertions, per-endpoint rules, and lower operational noise.
Features
A solid base for teams that scale
Distributed monitoring
Multi-region, consensus validation, and high precision.
API Monitoring
JSON assertions, logical validation, and advanced per-endpoint rules.
Reliable alerts
Less noise and decisions based on consensus.
Secure by default
Strict validation, OAuth, and expiring invitations
Scalable operations
Real distributed architecture with decoupled execution (hub + probes).
Consensus-based multi-region validation system
Correlates checks across nodes to decide with higher confidence.
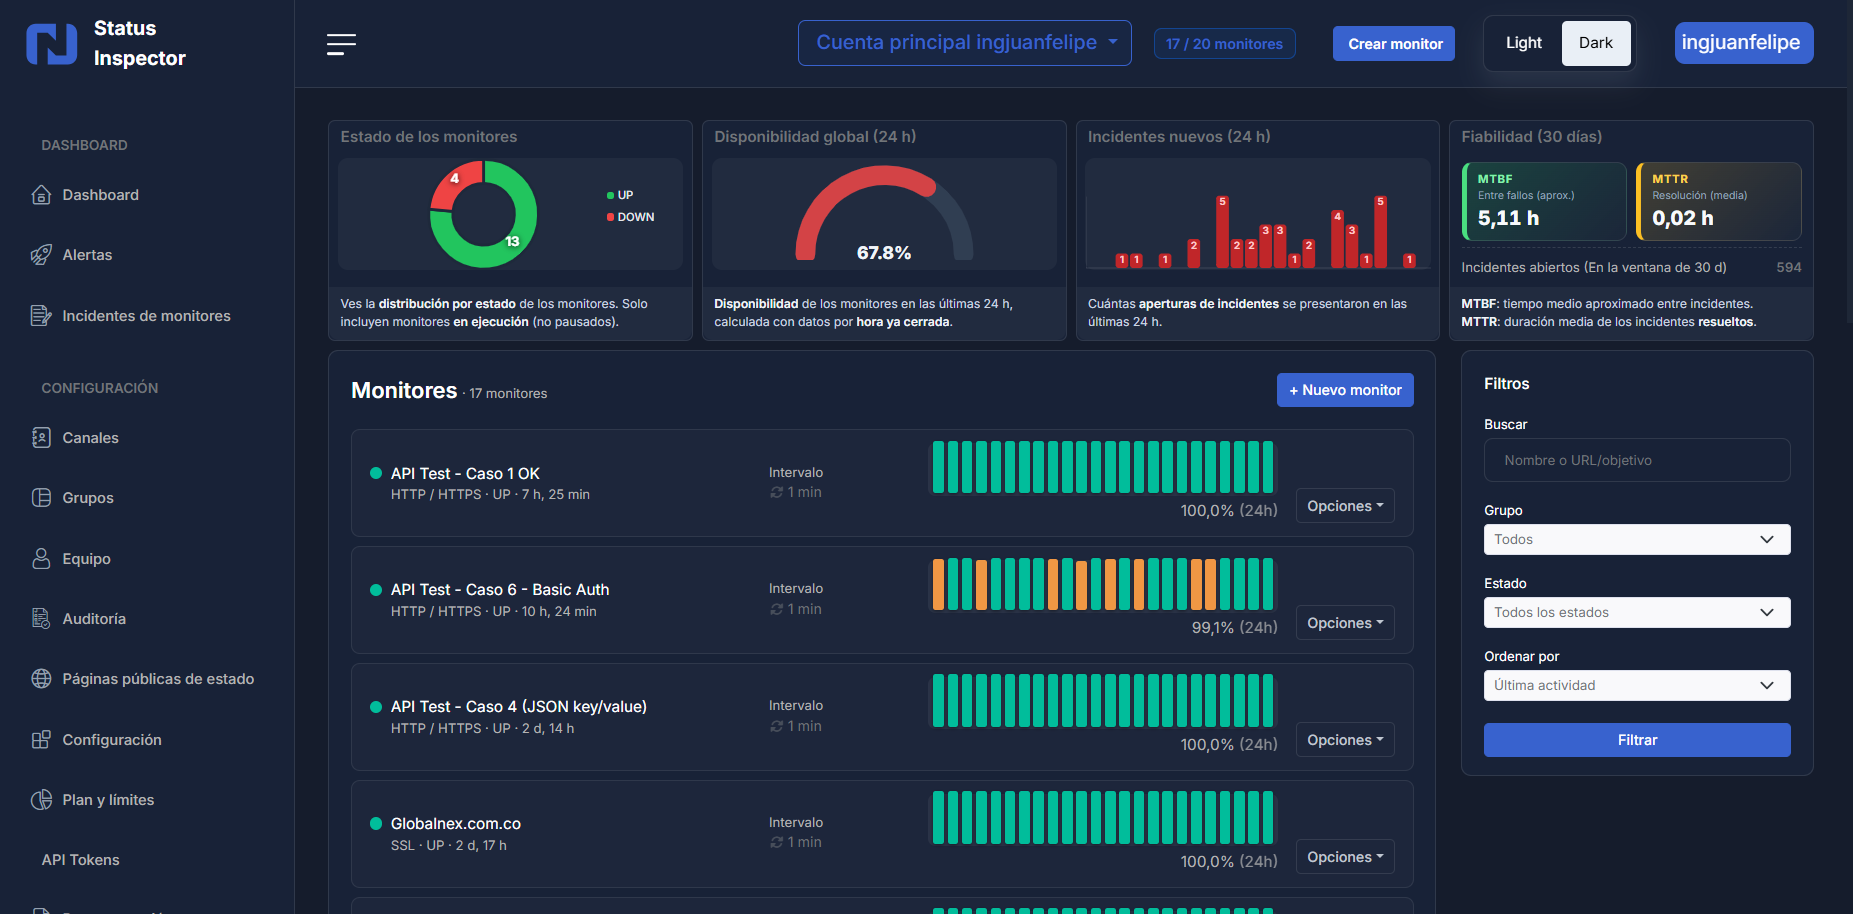
MTBF & MTTR
Reliability metrics in the dashboard: mean time between failures and mean time to recovery per service.
Your dashboard answers questions. Now it acts too.
Ask about the status of your services, review the last incident, or silence a monitor during a deployment — all from the chat built into the panel, no menus or searches needed.
- "How many monitors are down right now?"
- "Put the payments API in maintenance"
- "How long did the last incident last?"
- Answers with real data from your account, in seconds.
Included in all plans. No extra setup.
Start free. Scale when you grow.
Clear pricing vs “ping-only” competitors: intervals, API, assertions, Heartbeat, and multi-region detection on real distributed execution.
Launch offer: Free and Pro at no cost and no card during this phase. When billing goes live, Pro will use the indicative price shown on the card.
Value anchor: less than one engineering hour reacting late to a false “all green.”
Includes multi-region validation and advanced API monitoring according to plan.
Free
Validate the product with your team, no card.
Free plan with no time limit and no card.
Unlike “ping-only” offers, here you can validate that your API returns what you expect—not just a 200.
- Up to 20 monitors
- Minimum interval between checks: 5 minutes
- Up to 10 notification channels
- Up to 1 members (pending invitations count toward the limit)
- Up to 2 public status pages
- Up to 2 monitor groups
- Up to 50 alert rules
- Public API not available on this plan
Pro
The check cadence and API you expect in production.
No charge today
No surprises: real limits listed below.
Includes multi-region validation and advanced API monitoring
- Up to 200 monitors
- Minimum interval between checks: 1 minute
- Up to 50 notification channels
- Up to 10 members (pending invitations count toward the limit)
- Up to 25 public status pages
- Up to 20 monitor groups
- Up to 300 alert rules
- Public API: up to 120 requests per minute per token
- Advanced JSON assertions on HTTP/API monitors
- Heartbeat monitoring for cron/jobs (token check-in)
- MTBF and MTTR metrics in the panel (dashboard and monitor detail)
- AI Assistant with real account data
Enterprise
Limits, SLA, and integrations on your terms.
SLA, deployment, and commercial terms tailored to you.
- Expanded or unlimited operational limits by agreement
- SLA and tailored commercial terms
- Integrations, deployment, and dedicated support
Plan comparison
Same catalog you will see in the panel after signup. No hidden fine print: intervals, API, and key features side by side.
| Feature | Free | Pro | Enterprise |
|---|---|---|---|
| Minimum interval between checks | 5 minutes | 1 minute | 30 seconds |
| Monitors | 20 | 200 | Unlimited |
| Public API (Bearer token) | No | Yes (up to 120 req/min) | Yes (up to 300 req/min) |
| JSON assertions (HTTP/API) | No | Yes | Yes |
| Heartbeat (cron / jobs) | No | Yes | Yes |
| Max regional nodes per check | 1 | 3 | 5 |
| Degraded state (latency / quality) | Yes | Yes | Yes |
| Alert channels | 10 | 50 | Unlimited |
| Team members | 1 | 10 | Unlimited |
| Integrated AI Assistant | No | Yes | Yes |
Frequently asked questions
- • Typical questions when choosing uptime and API monitoring
Are the plans paid?
No. Right now Free and Pro have no charge. There is no payment gateway and we do not ask for a credit card. Enterprise (custom) is handled via contact.
Where can I receive alerts?
Email, Slack, Discord, Google Chat, Telegram, Pushbullet, or a webhook URL you provide (for Zapier, Make, or your own stack). Each channel is configured once and linked to the alert rules you choose.
Can I share status with my customers?
Yes. Public status pages give you a URL (like /p/your-slug) to share. It shows the monitors you choose, recent uptime, and incidents you open or close from the panel.
Can I invite my team to the same account?
Yes. Invite by email and assign one of four roles: Owner, Admin, Editor, or Viewer. If the person has no account, they get a signup link; invitations expire after 7 days if not accepted.
How often do checks run?
It depends on the plan and monitor. On Free, the minimum interval between checks is 5 minutes; on Pro, 1 minute; on Enterprise, from 30 seconds.
Can I avoid alerts for one-off failures?
Yes. Each alert rule can set a consecutive failure threshold. For example with threshold 2: the first failed check sends no alert; if the second fails too, we notify you—reducing noise from latency spikes or brief restarts.
What happens when a monitor changes state?
When a service goes DOWN past your threshold, we create an alert event and notify configured channels. When it returns UP, a recovery event fires. In maintenance mode, availability alerts are not sent.
Does it include ICMP ping and Heartbeat?
Yes for ICMP ping as another monitor type (same execution queue, incidents, and alerts as HTTP/TCP). Cron/job Heartbeat check-ins are available on plans that include it in the catalog; the free plan does not allow creating it.
Can I use an API to manage monitors?
Yes: /api/v1 with Bearer token, scopes, and per-plan rate limits. Documentation and limits match the “Plan & limits” screen in the panel.
How do you avoid false positives?
We apply multi-region consensus validation before triggering critical alerts.
What does multi-region validation mean?
State does not depend on a single check: we correlate evidence from multiple active regions.
How does API monitoring work?
We run HTTP/API checks, evaluate timing/status, and validate payloads with rules and JSON assertions.
What can I validate with JSON assertions?
Payload structure, fields, values, and logic rules to detect failures even when the API returns 200.
What happens if I reach my plan limit?
The system warns you before hitting the limit. Existing monitors and data are never deleted; you simply cannot create new resources until you upgrade or remove existing ones.
When does Pro billing start?
Pro is free during the current launch phase. When billing goes live we will communicate it in advance. The indicative price is shown on the pricing card. You can choose to upgrade or stay on the free plan.
Can I cancel or change plans at any time?
Yes. No lock-in contracts. You can upgrade, downgrade, or cancel from the dashboard whenever you like. Historical data is retained according to your plan's retention policy.
Website monitoring SaaS, uptime monitoring tool, and API monitoring service
Status Inspector brings website monitoring, uptime monitoring tool, and API monitoring service into one panel: real validation (not just ping) for SaaS teams, DevOps, and technical teams. Catch outages, errors, and degradation before end users or the business feel the pain.
Contact
Support, Enterprise plans, or custom integrations: reach out.
contacto@statusinspector.com
Hours
Monday to Friday
9:00 - 18:00
- • Technical support and product questions
- • Enterprise access and integrations
- • Response via form
Win back minutes when they matter most
Every incident caught earlier is less time in support, less churn, and more trust. Start free and validate the flow with your team.
Fewer false alerts. More confidence in every decision.